Patient Trendfollower (7)(alpha) Backtesting AlgorithmThis is an alpha version of backtesting algorithm for my Patient Trendfollower (7) strategy. It can help you adapt the indicator to other charts than EURUSD. Please bear in mind that price action, volume profiles and supzistences are a catalyst for successful trading, not an indicator. You can get significantly better results if you use these things in your trading and use Trendfollower only as a secondary tool.
Patient Trendfollower Indicator
Thanks belongs to @everget and Satik FX, their contributions are highlighted on an indicator page.
在腳本中搜尋"volume profile"

Delta Volume Columns [LucF]Displays delta volume columns using intrabar volume information. Each volume column is divided into three sections: buying, selling and neutral volume. Volume for each section is determined from the volume and price movement of each intrabar at a user-selected lower resolution.
Features include:
- Choice of color themes for either dark or light chart backgrounds
- Delta volume columns
- Volume Balance displayed as the difference between the MAs of buying and selling volume
- Display of divergences between a bar’s volume balance and the bar’s price movement (example: buying volume > selling volume but close < open). Divergences can be shown in 2 different color schemes (including green/red showing a tentative direction), on volume columns and/or on chart bars
- Display of bar by bar volume balance with highlighting of above average volume
- Display of the usual total volume MA
- Choice of the lower resolution used to retrieve intrabar information
- Alerts configurable on any combination of the markers, with control over long/short direction
- Choice of 3 different markers:
1. Double bumps: two consecutive bars where buying or selling volume is in the same direction and where volume > volume MA
2. Divergence confirmations: direction of the price bar following a price/volume balance divergence
3. Volume balance shifts: zero level crossings of the volume balance MA delta
The chart shows the two main modes of display:
- Top pane : shows the stacked volume columns with divergences in orange and the flattened volume balance MAs delta at the bottom of the volume columns. This volume balance is the same shown in the bottom pane. The top pane also shows the instant volume balance strip above the volume columns. The strip’s colors show which of the buying or selling volume was greater, and colors are brighter if the total volume was above the total volume MA.
- Bottom pane : shows the volume balance MAs delta with markers 1 and 2. Given that this graphic has no price momentum component, I find quite eerie how it often looks like a momentum-based signal.
The default 5 minute intrabar resolution is used in combination with the weekly chart, which is excessive.
This script uses a special characteristic of the security() function’s behavior when it is sent to a resolution lower than the chart’s resolution. Details are given in the script’s comments. This method has the advantage of working under more circumstances than some of the other loop-based methods, but it also has its limits.
IMPORTANT
This is what you need to know:
- The method used does not work on the realtime bar—only on historical bars. Consequently, the volume column shown on the realtime bar is a normal volume column plotted in green or red, following price movement. The column will only show delta volume information after it closes and becomes a historical bar.
- The indicator only works on some chart resolutions: 5, 10, 15 and 30 minutes, 1, 2, 4, 6, and 12 hours, 1 day, 1 week and 1 month. The script’s code can be modified to run on other resolutions, but chart resolutions must be divisible by the lower resolution used for intrabars.
- Intrabar resolutions can be selected from 1, 5, 15, 30, 45 minutes, 1, 2, 3, 4 hours, 1 day, 1 week and 1 month. The intrabar resolution must of course be smaller than the chart’s resolution.
- Contrary to my other indicators where alerts must be configured to trigger “Once Per Bar Close” in order to avoid false triggers (or repainting), all this indicator’s alerts are designed to trigger using previous bar information since the indicator’s calculations in the realtime bar are not exact. Markers are not plotted with a negative offset; they appear at the beginning of the realtime bar following confirmation of the marker’s condition on the previous bar. Alerts for this indicator should thus be configured to trigger “Once Per Bar” so they trigger at the beginning of the realtime bar. Note that the penalty is not that great, as it is simply the instant between the close of the previous realtime bar and the opening of the next. The advantage of using this technique is that the indicator does not repaint; a marker that appears at the beginning of the realtime bar will never disappear.
- The script only plots information that is reliable in the realtime bar, i.e., total volume and markers. All other plots are set to n/a to prevent misleading traders.
- When the difference between the chart’s resolution and the lower resolution is too important, volume columns will not calculate for all bars in the dataset.
On Delta Volume
Buying or selling volume are misnomers, as every unit of volume transacted is both bought and sold by 2 different traders. There is no such thing as “buy only” or “sell only” volume, but trader lingo is riddled with original fabulations.
Without access to order book information, traders work with the assumption that when price moves up during a bar, there was more buying pressure than selling pressure. The built-in volume indicator available on TradingView uses this logic to color the volume columns green or red. While this script’s numbers are more precise because it analyses a number of intrabars to calculate its information, it uses the exact same imperfect logic to calculate its buying/selling/neutral sections.
Until Pine scripts can have access to how much volume was transacted at the bid/ask prices, our so-called buying/selling volume information will always be a mere proxy.
Divergences
You may wonder how there can be divergences between buying/selling volume information and price movement. This will sometimes be due to the methodology’s shortcomings we have just discussed, but divergences may also occur in instances where because of order book structure, it takes less volume to increase the price of an asset than it takes to decrease it.
As usual, divergences are points of interest because they reveal imbalances, which may or may not become turning points. I do not share the overwhelming enthusiasm traders have for divergences. To your pattern-hungry brain, the orange bars this indicator shows on chart will—as divergences on other indicators do–appear to often indicate turnarounds. My opinion is that reality is generally quite sobering, as many who have tried building automated rules based on divergences will tell you. I do not have hard numbers on the lack of performance of divergences—only many failed attempts to make them perform, which a few experienced strategy modelers I know share with me. Please don’t try to read too much into them. While they look great on past data, I find they are often difficult to use in realtime to make bets with good odds.
Thanks to:
- A guy called Kuan who commented on a Backtest Rookies presentation of an intrabar delta volume indicator using a for loop. The heart of “my” indicator is code borrowed from Kuan; I just built a hopefully useful wrapper around it.
- @theheirophant, my partner in the exploration of the sometimes weird abysses of security() ’s behavior at lower resolutions.

moving quantilesAlways works... Just kidding, indicates moving quantiles. Something between volume profiles and moving averages.

Orderflow Bias Premium v2 [Pro+]Orderflow Bias Premium v2 is a dynamic Pine v6 indicator designed to identify periods of consolidation (choppy) markets versus expansion (trending) markets using a blend of volatility, volume, and market structure. When markets shift into expansion, the script computes a composite directional bias (“Bullish”, “Bearish”, or “Neutral”) along with a trend strength metric. In consolidation, it tracks how long price remains choppy, displaying elapsed minutes. All information is presented in a floating table at the top-right of the chart for instant visual clarity - with each field toggleable on / off by the user.
Key Terms and Definitions
Consolidation : A market regime where price action is confined within narrow Bollinger Band widths, low ATR/price ratios, and subdued volume—signaling uncertainty or indecision.
Expansion : A market regime where volatility, ATR, or volume “break out” of low percentile thresholds, suggesting a trending move.
Bollinger Band Width (BBW) : The normalized distance between the upper and lower Bollinger Bands, calculated as (upper – lower) / basis. Used here to detect when volatility is suppressed.
ATR/Price Ratio : The average true range (ATR) divided by the current close, normalized as a percentage. A lower ratio indicates tighter price action.
Volume Ratio (VR) : Current volume divided by its moving average; when VR is below a historical percentile, volume is considered “low.”
Percentile Test : For each metric (BBW, ATR/price, VR), we compute the current value’s rank (e.g., 20th percentile) over a look-back window. If the current value is below that percentile (after applying any intraday multipliers), it counts as “low.”
Imbalance (3-Bar Gap) : A price pattern where, two bars ago, the high is lower than the current bar’s low (bullish imbalance) or the low is higher than the current bar’s high (bearish imbalance). The script tracks whether any such gap has formed in a higher timeframe to seed directional memory.
Directional Bias : When in expansion, three methods vote on market direction: (1) DMI spread, (3) impulse-bar majority, and (4) last imbalance direction. The summed votes determine “Bullish”, “Bearish”, or “Neutral.”
Hysteresis (Bars to Flip State) : The number of consecutive bars required for a new regime (consolidation ↔ expansion) to be confirmed. This prevents false flips from single-bar noise.
Key Features
Dynamic Regime Detection
Combines BBW, ATR/price, and volume percentile tests to detect low-volatility consolidation vs. breakouts.
Supports optional intraday multipliers to scale thresholds during open (09:30–10:15), lunch (11:45–13:30), and power hour (15:30–16:00).
Optional higher-timeframe filter (current TF × user-defined multiplier) ensures false consolidations are avoided when the next larger TF is still trending.
Intuitive Chop Enhancements
N-Bar Range Test: Flags chop if (highest high – lowest low) over N bars < ATR×multiplier.
ADX Test: Considers ADX < user threshold as choppy.
RSI Flat Test: Marks chop if RSI range over N bars < threshold.
SMA Deviation Test: Detects chop if |price – SMA| (normalized by ATR) < threshold.
Composite Directional Bias (Expansion Only)
Method 1: DMI spread vote (+DI vs. –DI).
Method 2: Impulse-bar majority over a rolling window.
Method 3:Memory of last 3-bar imbalance on a user-specified higher TF.
Strength Metric:ADX normalized to percentage + textual category (Low/Moderate/High/Very High) indicates trend momentum.
Real-Time Table Display
2-column, 3-row floating table at top-right.
How Traders Can Use the Indicator Effectively
Timing Breakouts
While price remains in consolidation, the elapsed timer can reveal when an extended chop may soon resolve—enabling traders to anticipate breakouts.
Filtering Noise on Lower TFs
By enabling the higher-TF filter (e.g., 5 min chart screening 15 min chop), intraday traders can avoid false expansion signals caused by micro-noise.
Directional Confirmation
In expansion mode, seeing “Orderflow: Bullish” + “Strength: High” can be used as confluence alongside price-action entries or trendline breaks.
Combining with Other Tools
Pair with volume profile, market structure (swing highs/lows), or momentum oscillators for multi-dimensional confirmation before taking a trade.
USER TOGGLEABLE INPUTS
Show State
Toggles displaying the “State:” row (Consolidation vs. Expansion) in the table.
Show Strength
Toggles displaying the ADX-based strength (or, in consolidation, elapsed time) row in the table.
Show OrderFlow Bias
Toggles displaying the “Orderflow” (directional bias) row (or “Bias: Neutral” in consolidation).
Bars to Flip State
Number of consecutive bars required before switching between “Consolidation” and “Expansion.”
Enable BBW Percentile Test
Toggles whether Bollinger-Band-width percentile checks count toward identifying consolidation.
BB Length
Look-back length (in bars) for computing the Bollinger Band’s SMA/standard deviation.
BB StdDev Mult
Multiplier on the Bollinger Band’s standard deviation when calculating bandwidth.
BBW Look-back
Number of bars over which to compute the rolling percentile of BB width.
BBW Percentile
Percentile threshold for BB width to be considered “low” (choppy).
Enable ATR Percentile Test
Toggles whether the ATR/price-ratio percentile check counts toward consolidation.
ATR Length
Look-back length (in bars) for calculating ATR.
ATR Look-back
Number of bars over which to compute the rolling percentile of ATR/price.
ATR Percentile
Percentile threshold for ATR/price ratio to be considered “low.”
Enable Volume Percentile Test
Toggles whether volume percentile checks count toward consolidation.
Volume MA Length
Look-back length (in bars) for computing the moving average of volume.
Vol Percentile
Percentile threshold for current volume (relative to its MA) to be considered “low.”
Vol Factor (fallback)
Multiplier applied to the volume percentile threshold if the primary percentile test fails.
Enable Intraday Multipliers
Toggles whether open/lunch/power-hour scaling factors apply to BBW/ATR tests.
BBW Open/Power Mult
Multiplier on BB width threshold during market open (09:30–10:15) and power hour (15:30–16:00).
ATR Open/Power Mult
Multiplier on ATR threshold during market open and power hour.
BBW Lunch Mult
Multiplier on BB width threshold during the lunch lull (11:45–13:30).
ATR Lunch Mult
Multiplier on ATR threshold during the lunch lull.
Enable Higher TF Filter
Toggles checking the BBW/ATR/Vol tests on a higher timeframe before allowing consolidation.
Higher-TF Multiplier
Integer factor by which to multiply the current timeframe (e.g., 5 min × 3 = 15 min) for higher-TF checks.
Show ADX Strength
Toggles whether ADX is used to compute and display the “Strength” metric when expanding.
ADX Length
Look-back length (in bars) for computing DMI/ADX.
Table Opacity %
Opacity (0–100) of the floating table’s background.
DI Spread Threshold
Minimum difference between +DI and −DI needed to cast a bullish or bearish vote in directional bias.
Impulse Window Size
Number of bars over which to count “impulse bars” (close in top 40 % vs. bottom 40 %) for directional voting.
Enable Bar Range Test
Toggles checking if the N-bar high–low range is unusually narrow (another chop criterion).
Range Test N Bars
Look-back period (in bars) for computing the highest high minus lowest low for the range test.
Range Test ATR Mult
Multiplier on the average ATR when comparing against the N-bar range.
Enable ADX Test
Toggles marking “choppy” if ADX is below the user-defined threshold.
ADX Threshold
ADX value below which the market is considered non-trending (choppy).
Enable RSI Flat Test
Toggles checking whether RSI has been stuck in a tight range (another chop signal).
RSI Length
Look-back length (in bars) for computing standard RSI.
RSI Range N Bars
Look-back period (in bars) for computing RSI’s highest minus lowest.
RSI Range Threshold
Maximum RSI range over the look-back period to qualify as “flat.”
Enable SMA Deviation Test
Toggles checking if price is “near” its SMA (another chop heuristic).
SMA Length
Look-back length (in bars) for computing the simple moving average (SMA).
Dev Test ATR Length
Look-back length (in bars) for ATR when normalizing deviation from the SMA.
Dev Threshold (ATR units)
Maximum (|price − SMA| / ATR) allowed to count as “near” the SMA.
Enable TF1
Toggles the higher-timeframe imbalance logic on or off.
Timeframe 1
Base resolution (e.g., “1” = 1 minute) used for detecting 3-bar imbalances.
Lookback Timeframe
Higher timeframe (e.g., “15” = 15 minutes) used to compute how many base-resolution bars to look back.
Bars 1
(Calculated internally) Number of base-timeframe bars contained within one lookback-timeframe bar.
Terms and Conditions
Informational Purposes Only : OrderFlow Bias v2 Premium is provided without any guarantees. It is not financial advice, nor does it predict market movements. Users assume full responsibility for any trading decisions made.
No Liability : By using this indicator, you acknowledge that neither the script’s author nor TradingView is liable for losses arising from its use. Past performance is not indicative of future results.
Licensing : This script is published as closed-source (protected). Its Pine code is hidden from view and may not be forked, modified, or redistributed without express permission from the author. Protected scripts on TradingView require a Pro, Pro+, or Premium account to publish and remain accessible only to invited users; all usage rights and access control are governed by the author’s invite settings.
Disclaimer
The information and code in OrderFlow Bias v2 Premium are provided “as is” for educational and analytical purposes only. They do not constitute any investment, trading, or financial advice. Users should conduct their own due diligence and seek professional counsel before making trading decisions. The author and TradingView disclaim all liability for actions based on this information.

Delta AO + Regular AO (Normalized)🔀 Delta AO + Regular AO (Normalized) – Visualizing Market moods becomes simpler 🔀
🧠 Introduction
The Delta AO + Regular AO (Normalized) is a custom oscillator that fuses the power of classic momentum analysis with volume-derived delta flow to give traders a dual-perspective edge.
This tool was born from a need to better visualize internal market thrust (via delta) while still respecting the time-tested signal power of the traditional Awesome Oscillator (AO).
🔍 What makes it unique?
✅ Volume-based Delta Calculation – Models upward/downward delta using a custom volatility-weighted volume allocation method, not simple tick-delta or raw buys/sells.
✅ Cumulative Delta Candles – Instead of just plotting bars, the indicator rebuilds the market structure using cumulative delta logic.
✅ Dual AO Display – Shows both custom delta AO and traditional price AO simultaneously.
✅ Normalized Scaling – Each AO is independently normalized by its standard deviation (volatility-adjusted), making both indicators visually comparable without distortion.
🧮 Under the Hood
Let’s break down the components:
1. Delta Logic 📊
Rather than using raw delta or tick-level data, this script simulates net effort:
Delta Up = Volume × a smart weighting when the candle is bullish
Delta Down = Volume × weighting when the candle is bearish
The weighting dynamically adjusts based on candle body-to-wick ratio. This provides a more refined delta estimate based on candle structure.
This delta is accumulated (cumulative delta) and used to form a synthetic OHLC candle structure.
2. AO Calculations ⚖️
Custom AO: Calculated from the median of synthetic delta candles
Regular AO: Classic (median price 5-period SMA - 34-period SMA)
Both are normalized using their own 34-bar standard deviation, improving comparability and visualization in one pane.
3. Color Coding 🎨
For the delta AO histogram:
Lime: Bullish + Increasing Momentum
Green: Bullish + Weakening Momentum
Red: Bearish + Increasing Momentum (to the downside)
Maroon: Bearish + Weakening Momentum
This lets you immediately spot momentum shifts and strength behind volume-based moves.
📈 How to Use – Trading Guide
🔧 Recommended Setup:
Timeframe: Works well on all intraday and higher timeframes (5m–1D)
Symbol: Especially effective on liquid instruments (futures, indices, large caps)
✅ Entry Signals
🔹 Buy Setup
Delta AO turns green or lime above zero, and Regular AO is also rising
Ideal confirmation: Lime bar (strong bullish delta momentum) and a crossover above zero
🔹 Sell Setup
Delta AO turns maroon or red below zero, and Regular AO is also falling
Ideal confirmation: Red bar (strong bearish delta momentum) and AO falling further below zero
🔄 Momentum Confirmation
Look for divergence between the Delta AO and Regular AO.
🔼 If Delta AO is rising but Regular AO is flat or falling → Volume is leading price (possible breakout ahead)
🔽 If Regular AO is strong but Delta AO fades → Price may be unsustainable (fakeout risk)
🛑 Exit / Reversal Clues
Sudden color shifts (e.g., Lime → Green → Maroon) can signal momentum exhaustion
Both AOs converging to zero suggests consolidation phase ahead
📌 Pro Tips
Use this with volume profile, support/resistance, or market structure zones for maximum confluence
Works great as a secondary confirmation tool for your existing strategy
💬 Final Thoughts
This oscillator is not just a pretty double AO — it's a strategic fusion of price and volume time-series designed to help you anticipate shifts before they’re obvious in price alone.
If you're looking for:
A modernized AO
Volume-integrated signal clarity
Normalized, noise-filtered momentum visual
Then this tool belongs in your chart arsenal.
📈 Try it. Test it. Pair it. If you find value, consider sharing or following for more next-gen indicators.
Please note this is an educational idea and past performance is not assurance of future performance.
Happy trading!
— @Pratik_4Clover

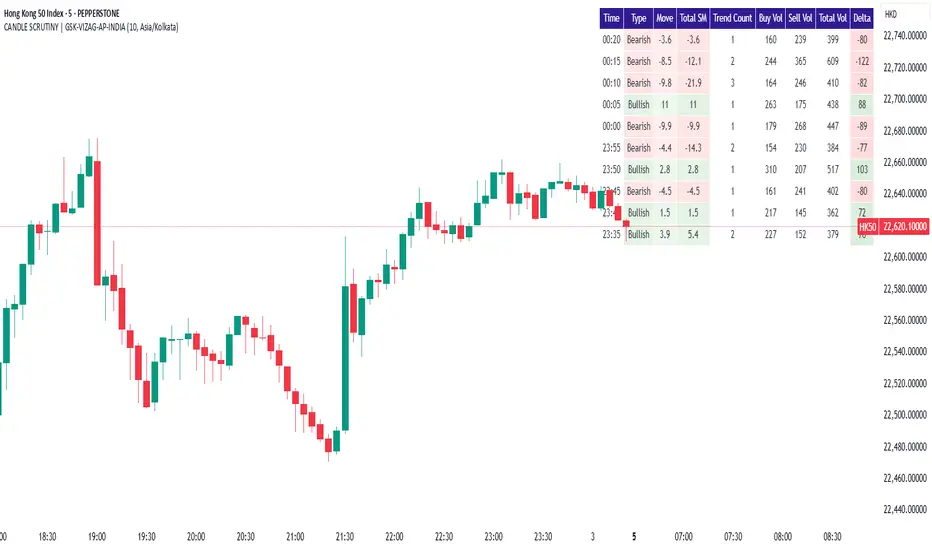
CANDLE SCRUTINY | GSK-VIZAG-AP-INDIAIndicator: CANDLE SCRUTINY | GSK-VIZAG-AP-INDIA
1. Overview
The CANDLE SCRUTINY indicator is a candle-by-candle analytical tool designed to dissect and visually represent the behavior of recent candles on a chart. It presents a concise table overlay that summarizes critical candlestick data including price movement, directional trend, volume dynamics, and strength of price sequences — all updated in real time.
2. Purpose / Trading Use Case
This tool is ideal for:
Scalpers and intraday traders needing quick real-time candle insights.
Trend analyzers who want to observe evolving price momentum.
Volume-based decision makers monitoring buyer-seller imbalance.
Traders who scrutinize candles for confirmations before entries or exits.
3. Key Features & Logic Breakdown
Candle Classification: Each candle is categorized as Bullish, Bearish, or Doji based on open-close comparison.
Move Calculation: Calculates and displays net candle move (Close - Open) for each bar.
Trend Count: Tracks the number of consecutive candles of the same type (bullish or bearish).
Sequential Move (Total SM): Aggregates move values when candles of the same type form a sequence.
Volume Breakdown: Approximates buy/sell volume ratio using candle type logic.
Delta Volume: Measures buy-sell imbalance to gauge intrabar strength.
Time Localization: Candle timestamps are shown in the user-selected timezone.
4. User Inputs / Settings
Number of Candles (numCandles): Choose how many recent candles to analyze (1–10).
Table Position (tablePos): Set to top_right by default.
Timezone Selector (tzOption): Choose from multiple global timezones (e.g., IST, UTC, NY, London) to view local candle times.
These settings let traders customize the scope and perspective of candle analysis to fit their trading region and strategy focus.
5. Visual & Plotting Elements
A floating data table appears on the chart (top-right by default), showing:
Time of candle (localized)
Type (Bullish/Bearish/Doji)
Move value with green/red background
Total SM (sequential movement) with trend-based color shading
Trend Count
Buy Volume, Sell Volume, Total Volume
Delta (volume imbalance) with color-coded strength indicator
Color coding makes it visually intuitive to quickly assess strength, direction, and sequence.
6. Effective Usage Tips
Use in 1-minute to 15-minute timeframes for scalping or momentum breakout confirmation.
Monitor Delta and Sequential Move (SM) to confirm strength behind price action.
Trend Count helps gauge sustained direction—useful for short-term trend continuation strategies.
Combine with support/resistance zones or volume profile for stronger confluence.
Great for detecting early signs of exhaustion or continuation.
7. What Makes It Unique
Combines price action + volume behavior + trend memory into one compact visual table.
Allows user-defined timezone adjustment, a rare feature in similar indicators.
Designed to give a story of the last N candles from a momentum and participation viewpoint.
Fully non-intrusive overlay—doesn't clutter chart space.
8. Alerts / Additional Features
Currently no alerts, but future versions may include:
Alert when trend count exceeds a threshold
Alert on strong delta volume shifts
Alert on back-to-back Dojis (sign of indecision)
9. Technical Concepts Used
Candlestick Logic: Bullish, Bearish, Doji classification
Volume Analysis: Approximate buy/sell split based on candle type
Color Coding: For intuitive interpretation of move, trend, and delta
Arrays & Looping Logic: Efficient tracking of trends and sequences
Timezone Handling: Uses hour(time, timezone) and minute(time, timezone) for local display
10. Disclaimer
This script is provided for educational and informational purposes only. It does not constitute financial advice. Always backtest thoroughly and use appropriate risk management when applying this or any indicator in live markets. The author is not responsible for any financial losses incurred.
VPSRVP Sovereign Reign (VPSR) - Advanced Volume Profile Analysis
A sophisticated volume analysis tool that provides deep insights into market participation and momentum through an intuitive visual interface. This indicator helps traders identify significant market moves, potential reversals, and institutional activity.
Key Features:
1. Smart Volume Analysis
• Dynamic volume profiling
• Institutional participation detection
• Abnormal volume identification
• Real-time momentum tracking
2. Advanced Visual System
• Color-coded volume bars
• Adaptive cloud formation
• Reversal pattern detection
• Fake-out warning system
Visual Components:
1. Volume Bars
• Green: Bullish pressure with normal volume
• Purple: Bearish pressure with normal volume
• White: Significant bullish participation
• Pink: Significant bearish participation
• Orange: High-probability reversal zones
2. Dynamic Cloud
• White Cloud: Bullish control zone
• Purple Cloud: Bearish control zone
• Cloud density indicates participation strength
• Adaptive to market conditions
Signal Interpretation:
1. Normal Market Conditions
• Green/Purple bars show directional pressure
• Cloud color indicates dominant force
• Cloud height shows average participation
2. Significant Events
• White/Pink bars signal major moves
• Orange bars highlight potential reversals
• Cloud expansion shows increasing activity
• Cloud contraction indicates consolidation
Customization Options:
• Volume MA Length: Smoothing factor
• Abnormal Volume Threshold: Sensitivity
• Cloud Display: Toggle visualization
• Color scheme optimization
Best Practices:
1. Multiple Timeframe Analysis
• Start with higher timeframes
• Confirm on lower timeframes
• Watch for confluence
2. Volume Analysis
• Compare to historical levels
• Monitor abnormal spikes
• Track participation trends
3. Trade Management
• Use as confirmation tool
• Wait for clear signals
• Monitor fake-out warnings
• Combine with price action
Trading Applications:
1. Trend Analysis
• Identify strong moves
• Spot weakening trends
• Detect consolidation
2. Reversal Detection
• Spot potential turning points
• Identify fake-outs
• Monitor institutional activity
3. Risk Management
• Volume-based position sizing
• Stop loss placement
• Profit target selection
The VP Sovereign Reign indicator excels at:
• Identifying significant market moves
• Detecting institutional participation
• Warning of potential reversals
• Highlighting fake-outs
• Providing clear market context
Risk Warning:
This indicator is designed as a technical analysis tool and should be used as part of a complete trading strategy. Past performance does not guarantee future results. Always employ proper risk management techniques.
Note: For optimal results, use in conjunction with price action analysis and other complementary indicators.

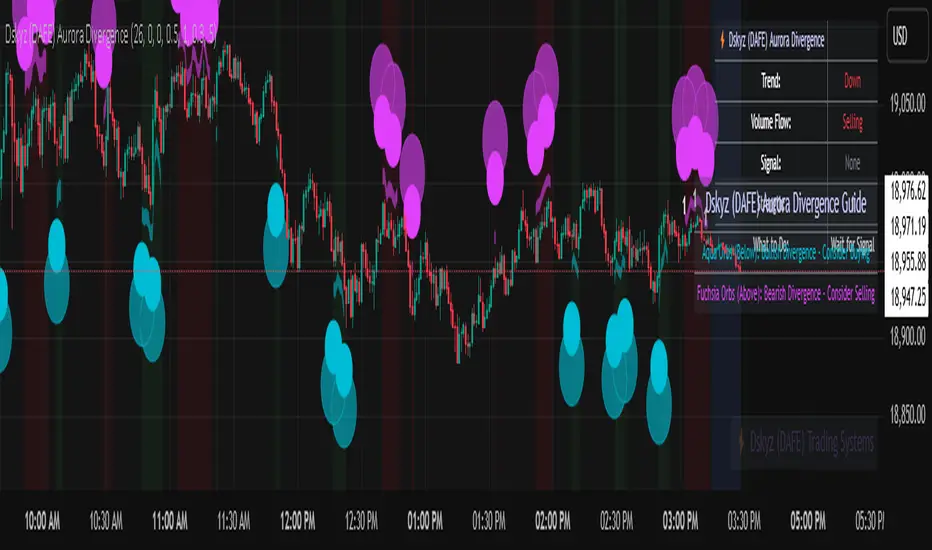
Dskyz (DAFE) Aurora Divergence - Dskyz (DAFE) Aurora Divergence Indicator
Advanced Divergence Detection for Traders. Unleash the power of divergence trading with this cutting-edge indicator that combines price and volume analysis to spot high-probability reversal signals.
🧠 What Is It?
The Dskyz (DAFE) Aurora Divergence Indicator is designed to identify bullish and bearish divergences between the price trend and the On Balance Volume (OBV) trend. Divergence occurs when the price of an asset and a technical indicator (in this case, OBV) move in opposite directions, signaling a potential reversal. This indicator uses linear regression slopes to calculate the trends of both price and OBV over a specified lookback period, detecting when these two metrics are diverging. When a divergence is detected, it highlights potential reversal points with visually striking aurora bands, orbs, and labels, making it easy for traders to spot key signals.
⚙️ Inputs & How to Use Them
The indicator is highly customizable, with inputs grouped under "⚡ DAFE Aurora Settings" for clarity. Here’s how each input works:
Lookback Period: Determines how many bars are used to calculate the price and OBV slopes. Higher values detect longer-term trends (e.g., 20 for 1H charts), while lower values are more responsive to short-term movements.
Price Slope Threshold: Sets the minimum slope value for the price to be considered in an uptrend or downtrend. A value of 0 allows all slopes to be considered, while higher values filter for stronger trends.
OBV Slope Threshold: Similar to the price slope threshold but for OBV. Helps filter out weak volume trends.
Aurora Band Width: Adjusts the width of the visual bands that highlight divergence areas. Wider bands make the indicator more visible but may clutter the chart.
Divergence Sensitivity: Scales the strength of the divergence signals. Higher values make the indicator more sensitive to smaller divergences.
Minimum Strength: Filters out weak signals by only showing divergences above this strength level. A default of 0.3 is recommended for beginners.
Signal Cooldown (Bars): Prevents multiple signals from appearing too close together. Default is 5 bars, reducing chart clutter and helping traders focus on significant signals.
These inputs allow traders to fine-tune the indicator to match their trading style and timeframe.
🚀 What Makes It Unique?
This indicator stands out with its innovative features:
Price-Volume Divergence: Combines price trend (slope) and OBV trend for more reliable signals than price-only divergences.
Aurora Bands: Dynamic visual bands that highlight divergence zones, making it easier to spot potential reversals at a glance.
Interactive Dashboard: Displays real-time information on trend direction, volume flow, signal type, strength, and recommended actions (e.g., "Consider Buying" or "Consider Selling").
Signal Cooldown: Ensures only the most significant divergences are shown, reducing noise and improving usability.
Alerts: Built-in alerts for both bullish and bearish divergences, allowing traders to stay informed even when not actively monitoring the chart.
Beginner Guide: Explains the indicator’s visuals (e.g., aqua orbs for bullish signals, fuchsia orbs for bearish signals), making it accessible for new users.
🎯 Why It Works
The indicator’s effectiveness lies in its use of price-volume divergence, a well-established concept in technical analysis. When the price trend and OBV trend diverge, it often signals a potential reversal because the underlying volume support (or lack thereof) is not aligning with the price action. For example:
Bullish Divergence: Occurs when the price is making lower lows, but the OBV is making higher lows, indicating weakening selling pressure and potential upward reversal.
Bearish Divergence: Occurs when the price is making higher highs, but the OBV is making lower highs, suggesting weakening buying pressure and potential downward reversal.
The use of linear regression ensures smooth and accurate trend calculations over the specified lookback period. The divergence strength is then normalized and filtered based on user-defined thresholds, ensuring only high-quality signals are displayed. Additionally, the cooldown period prevents signal overload, allowing traders to focus on the most significant opportunities.
🧬 Indicator Recommendation
Best For: Traders looking to identify potential trend reversals in any market, especially those where volume data is reliable (e.g., stocks, futures, forex).
Timeframes: Suitable for all timeframes. Adjust the lookback period accordingly—smaller values for shorter timeframes (e.g., 1H), larger for longer ones (e.g., 4H or daily).
Pair With: Support and resistance levels, trend lines, other oscillators (e.g., RSI, MACD) for confirmation, and volume profile tools for deeper analysis.
Tips:
Look for divergences at key support/resistance levels for higher-probability setups.
Pay attention to signal strength; higher strength divergences are often more reliable.
Use the dashboard to quickly assess market conditions before entering a trade.
Set up alerts to catch divergences even when not actively watching the chart.
🧾 Credit & Acknowledgement
This indicator builds upon the classic concept of price-volume divergence, enhancing it with modern visualization techniques, advanced filtering, and user-friendly features. It is designed to provide traders with a powerful yet intuitive tool for spotting reversals.
📌 Final Thoughts
The Dskyz (DAFE) Aurora Divergence Indicator is more than just a divergence tool; it’s a comprehensive trading assistant that combines advanced calculations, intuitive visualizations, and actionable insights. Whether you’re a seasoned trader or just starting out, this indicator can help you spot high-probability reversal points with confidence.
Use it with discipline. Use it with clarity. Trade smarter.
**I will continue to release incredible strategies and indicators until I turn this into a brand or until someone offers me a contract.
-Dskyz
SMC+The "SMC+" indicator is a comprehensive tool designed to overlay key Smart Money Concepts (SMC) levels, support/resistance zones, order blocks (OB), fair value gaps (FVG), and trap detection on your TradingView chart. It aims to assist traders in identifying potential areas of interest based on price action, swing structures, and volume dynamics across multiple timeframes. This indicator is fully customizable, allowing users to adjust lookback periods, colors, opacity, and sensitivity to suit their trading style.
Key Components and Functionality
1. Key Levels (Support and Resistance)
This section plots horizontal lines representing support and resistance levels based on highs and lows over three distinct lookback periods, plus daily nearest levels.
Short-Term Lookback Period (Default: 20 bars)
Plots the highest high (short_high) and lowest low (short_low) over the specified period.
Visualized as dotted lines with customizable colors (Short-Term Resistance Color, Short-Term Support Color) and opacity (Short-Term Resistance Opacity, Short-Term Support Opacity).
Adjustment Tip: Increase the lookback (e.g., to 30-50) for less frequent but stronger levels on higher timeframes, or decrease (e.g., to 10-15) for scalping on lower timeframes.
Long-Term Lookback Period (Default: 50 bars)
Plots broader support (long_low) and resistance (long_high) levels using a solid line style.
Customizable via Long-Term Resistance Color, Long-Term Support Color, and their respective opacity settings.
Adjustment Tip: Extend to 100-200 bars for swing trading or major trend analysis on daily/weekly charts.
Extra-Long Lookback Period (Default: 100 bars)
Identifies significant historical highs (extra_long_high) and lows (extra_long_low) with dashed lines.
Configurable with Extra-Long Resistance Color, Extra-Long Support Color, and opacity settings.
Adjustment Tip: Use 200-500 bars for monthly charts to capture macro-level key zones.
Daily Nearest Resistance and Support Levels
Dynamically calculates the nearest resistance (daily_res_level) and support (daily_sup_level) based on the current day’s price action relative to historical highs and lows.
Displayed with Daily Resistance Color and Daily Support Color (with opacity options).
Adjustment Tip: Works best on intraday charts (e.g., 15m, 1h) to track daily pivots; combine with volume profile for confirmation.
How It Works: These levels update dynamically as new highs/lows form, providing a visual guide to potential reversal or breakout zones.
2. SMC Inputs (Smart Money Concepts)
This section identifies swing structures, order blocks, fair value gaps, and entry signals based on SMC principles.
SMC Swing Lookback Period (Default: 12 bars)
Defines the period for detecting swing highs (smc_swing_high) and lows (smc_swing_low).
Adjustment Tip: Increase to 20-30 for smoother swings on higher timeframes; reduce to 5-10 for faster signals on lower timeframes.
Minimum Swing Size (%) (Default: 0.5%)
Filters out minor price movements to focus on significant swings.
Adjustment Tip: Raise to 1-2% for volatile markets (e.g., crypto) to avoid noise; lower to 0.2-0.3% for forex pairs with tight ranges.
Order Block Sensitivity (Default: 1.0)
Scales the size of detected order blocks (OBs) for bullish reversal (smc_ob_bull), bearish reversal (smc_ob_bear), and continuation (smc_cont_ob).
Visuals include customizable colors, opacity, border thickness, and blinking effects (e.g., SMC Bullish Reversal OB Color, SMC Bearish Reversal OB Blink Thickness).
Adjustment Tip: Increase to 1.5-2.0 for wider OBs in choppy markets; keep at 1.0 for precision in trending conditions.
Minimum FVG Size (%) (Default: 0.3%)
Sets the minimum gap size for Fair Value Gaps (fvg_high, fvg_low), displayed as boxes with Fair Value Gap Color and FVG Opacity.
Adjustment Tip: Increase to 0.5-1% for larger, more reliable gaps; decrease to 0.1-0.2% for scalping smaller inefficiencies.
How It Works:
Bullish Reversal OB: Detects a bearish candle followed by a bullish break, marking a potential demand zone.
Bearish Reversal OB: Identifies a bullish candle followed by a bearish break, marking a supply zone.
Continuation OB: Spots strong bullish momentum after a prior high, indicating a continuation zone.
FVG: Highlights bullish gaps where price may retrace to fill.
Entry Signals: Plots triangles (SMC Long Entry) when price retests an OB with a liquidity sweep or break of structure (BOS).
3. Trap Inputs
This section detects potential bull and bear traps based on price action, volume, and key level rejections.
Min Down Move for Bear Trap (%) (Default: 1.0%)
Sets the minimum drop required after a bearish OB to qualify as a trap.
Visualized with Bear Trap Color, Bear Trap Opacity, and blinking borders.
Adjustment Tip: Increase to 2-3% for stronger traps in trending markets; lower to 0.5% for ranging conditions.
Min Up Move for Bull Trap (%) (Default: 1.0%)
Sets the minimum rise required after a bullish OB to flag a trap.
Customizable with Bull Trap Color, Bull Trap Border Thickness, etc.
Adjustment Tip: Adjust similarly to bear traps based on market volatility.
Volume Lookback for Traps (Default: 5 bars)
Compares current volume to a moving average (avg_volume) to filter low-volume traps.
Adjustment Tip: Increase to 10-20 for confirmation on higher timeframes; reduce to 3 for intraday sensitivity.
How It Works:
Bear Trap: Triggers when price drops significantly after a bearish OB but reverses up with low volume or support rejection.
Bull Trap: Activates when price rises after a bullish OB but fails with low volume or resistance rejection.
Boxes highlight trap zones, resetting when price breaks out.
4. Visual Customization
Line Width (Default: 2)
Adjusts thickness of support/resistance lines.
Tip: Increase to 3-4 for visibility on cluttered charts.
Blink On (Default: Close)
Sets whether OB/FVG borders blink based on Open or Close price interaction.
Tip: Use "Open" for intraday precision; "Close" for confirmed reactions.
Colors and Opacity: Each element (OBs, FVGs, traps, key levels) has customizable colors, opacity (0-100), border thickness (1-5 or 1-7), and blink effects for dynamic visualization.
How to Use SMC+
Setup: Apply the indicator to any chart and adjust inputs based on your timeframe and market.
Key Levels: Watch for price reactions at short, long, extra-long, or daily levels for potential reversals or breakouts.
SMC Signals: Look for entry signals (triangles) near OBs or FVGs, confirmed by liquidity sweeps or BOS.
Traps: Avoid false breakouts by monitoring trap boxes, especially near key levels with low volume.
Notes:
This indicator is a visual aid and does not guarantee trading success. Combine it with other analysis tools and risk management strategies.
Performance may vary across markets and timeframes; test settings thoroughly before use.
For optimal results, experiment with lookback periods and sensitivity settings to match your trading style.
The default settings are optimal for 1 minute and 10 second time frames for small cap low float stocks.
Continuation OB are Blue.
Bullish Reversal OB color is Green
Bearish Reversal OB color is Red
FVG color is purple
Bear Trap OB is red with a green border and often appears with a Bearish Reversal OB signaling caution to a short position.
Bull trap OB is green with a Red border signaling caution to a long position.
All active OB area are highlighted and solid in color while other non active OB area are dimmed.
My personal favorite setups are when we have an active bullish reversal with an active FVG along with an active Continuation OB.
Another personal favorite is the Bearish reversal OB signaling an end to a recent uptrend.
The Trap OB detection are also a unique and Original helpful source of information.
The OB have a white boarder by default that are colored black giving a simulated blinking effect when price is acting in that zone.
The Trap OB border are colored with respect to direction of intended trap, all of which can be customized to personal style.
All vaild OB zones are shown compact in size ,a unique and original view until its no longer valid.

NIFTY VWAP DistanceNIFTY Futures VWAP Distance Indicator
Track price deviation from Volume-Weighted Average Price in real-time
📈 Key Features:
Measures absolute (points) and percentage distance from VWAP
Daily session reset aligned with NSE trading hours
Dual-axis visualization with clear zero reference line
Real-time data table display for instant analysis
Typical price calculation: (H+L+C)/3 formula
Built-in safeguards against division errors
🎯 Ideal For:
Intraday traders monitoring mean reversion opportunities
Algorithmic traders needing VWAP deviation metrics
Swing traders identifying overextended price moves
Market profile analysts studying auction theory
📊 How to Use:
Apply to NIFTY Futures chart (1m-1h timeframes recommended)
Blue line = Points above/below VWAP
Red line = Percentage deviation
Positive values = Price > VWAP (bullish territory)
Negative values = Price < VWAP (bearish territory)
💡 Pro Tips:
Combine with volume profile for confirmation
Watch for >1% deviations for potential reversals
Use divergence patterns for early trend change signals
Works best with raw futures data (not continuous contracts)
🔧 Technical Specs:
Pine Script v5+
No repainting
Low latency calculations
Mobile-friendly display
"Know when price strays too far from fair value"

Indiq 2.0The functionality of the indicator includes the following features:
Moving Averages (MA):
The ability to adjust periods for short (short_ma_length) and long (long_ma_length) moving averages.
Display of moving averages on the chart:
Short MA (blue line).
Long MA (red line).
Generation of buy and sell signals:
Buy (BUY): When the short MA crosses the long MA from below.
Sell (SELL): When the short MA crosses the long MA from above.
Visualization of signals on the chart:
Buy is displayed as a green BUY marker below the candle.
Sell is displayed as a red SELL marker above the candle.
Liquidity Heatmap:
Liquidity levels:
Levels are calculated based on the closing price and a step (liquidity_step).
Levels are grouped by the nearest price values.
Volumes at levels:
Volume (volume) is accumulated for each liquidity level.
Levels with a volume less than min_volume_filter are not displayed.
Time filtering:
Levels that have not been updated within the last time_filter bars are not displayed.
Volatility filtering:
Levels are filtered by volatility (ATR) to exclude those outside the volatility range.
Color gradient:
The color of levels depends on volume (gradient from gradient_start_color to gradient_end_color).
Visualization:
Liquidity levels are displayed as horizontal lines.
Volumes at levels are shown as text labels.
RSI Filtering:
The ability to enable/disable RSI filtering (rsi_filter).
Liquidity levels are filtered based on overbought (rsi_overbought) and oversold (rsi_oversold) conditions.
Levels that do not meet RSI conditions are not displayed.
MACD Filtering:
The ability to enable/disable MACD filtering (macd_filter).
Liquidity levels are filtered based on the MACD histogram condition (e.g., only if the histogram is above zero).
Levels that do not meet MACD conditions are not displayed.
Display of Market Maker Buys:
Condition for market maker buys:
Volume exceeds the average volume over the last 20 bars by 2 times.
Closing price is above the opening price.
Market maker buys are displayed on the chart as orange MM Buy markers below the candle.
Indicator Settings:
Moving average parameters:
short_ma_length: Period for the short MA.
long_ma_length: Period for the long MA.
Liquidity heatmap parameters:
liquidity_step: Step between liquidity levels.
max_levels: Maximum number of levels to display.
time_filter: Time filter (last N bars).
min_volume_filter: Minimum volume for displaying a level.
volatility_filter: Volatility filter (ATR multiplier).
RSI parameters:
rsi_filter: Enable/disable RSI filtering.
rsi_overbought: Overbought RSI level.
rsi_oversold: Oversold RSI level.
MACD parameters:
macd_filter: Enable/disable MACD filtering.
Color settings:
gradient_start_color: Starting color of the gradient.
gradient_end_color: Ending color of the gradient.
Visualization:
Moving averages:
Short MA: Blue line.
Long MA: Red line.
Signals:
Buy: Green BUY marker.
Sell: Red SELL marker.
Liquidity heatmap:
Liquidity levels: Horizontal lines with a color gradient.
Volumes: Text labels at levels.
Market maker buys:
Orange MM Buy markers.
Alerts:
The ability to set alerts for signals:
Buy (BUY).
Sell (SELL).
Additional Features:
Flexible filter settings:
Filtering by time, volume, volatility, RSI, and MACD.
Extensibility:
The ability to add new filters (e.g., Stochastic, Volume Profile, etc.).
Visual customization:
Adjustment of colors, sizes, and display styles.
Summary:
The indicator provides a comprehensive tool for analyzing liquidity, generating trading signals, and tracking market maker activity. It combines:
A liquidity heatmap.
Signals based on moving averages.
Filtering by RSI and MACD.
Display of market maker buys.
Flexible settings and visualization.
This indicator is suitable for traders who want to analyze liquidity levels, identify entry and exit points, and monitor the actions of large market players.
Cumulative Volume Delta with SignalThis premium-grade technical indicator provides deep insights into market sentiment by tracking the difference between buying and selling pressure through volume analysis. SCVD offers a sophisticated approach to volume profile analysis, helping traders identify potential trend reversals and momentum shifts before price action confirms them.
Key Features:
Real-Time Volume Delta Analysis: Visualizes buying vs. selling pressure through color-coded candles
Smart Signal Line Integration: EMA-based signal line helps identify trend changes and trading opportunities
Multi-Timeframe Capabilities: Automatically selects optimal lower timeframes for precision or can be customized
Daily Reset Option: Anchor period functionality for intraday delta analysis
Professional Visualization: Clean, color-coded display with zero reference line
Trading Applications:
Identify divergences between price action and volume delta for potential reversals
Spot accumulation/distribution patterns through delta behavior
Use signal line crossovers for entry/exit timing
Confirm trend strength by analyzing delta momentum
Detect potential false breakouts through volume confirmation
Perfect for day traders, swing traders, and institutional investors who rely on volume analysis for decision-making. This indicator combines sophisticated volume delta metrics with an intuitive interface to provide actionable trading insights across all markets and timeframes.

Dynamic Trend & Levels by VikOpineThis indicator combines the best aspects of trend-following, volume and price action to help traders make informed decisions and can be used with other indicators for confluence. 🚀
Key Features and Concepts:
Volume-Weighted Moving Average (VWMA):
Unlike a simple moving average, the VWMA gives more weight to price action with higher volume, helping traders identify strong trends backed by significant market participation.
It helps distinguish between low-volume price fluctuations and meaningful market moves.
Volume-Weighted Average Price (VWAP):
Used by institutional traders, VWAP serves as a benchmark to gauge whether the current price is overbought or oversold relative to the average price weighted by volume.
The indicator tracks VWAP levels dynamically, offering insights into price reversion opportunities and breakout confirmations.
Fibonacci Levels (Dynamic Support & Resistance):
The script dynamically plots Fibonacci retracement and extension levels based on recent price swings, allowing traders to identify potential reversal and continuation zones. These levels change colors individually based on them becoming support or resistance.
Fibonacci levels help in setting stop-loss levels and profit targets based on natural market cycles.
Ichimoku Cloud (Trend Confirmation & Market Sentiment):
Provides a multi-dimensional view of trend strength, momentum, and potential reversals.
The Kumo (cloud) helps traders identify support and resistance zones, while the Tenkan-Sen and Kijun-Sen lines confirm trend direction. I prefer to remove the lines and only keep the clouds to anticipate upcoming trend.
How the Indicator Works:
The script dynamically calculates and overlays VWMA and VWAP to give a clear view of volume-backed trends.
Fibonacci levels are recalculated based on recent swing highs and lows, ensuring they remain relevant to current price action. This feature avoids to re-draw Fibs manually.
The Ichimoku Cloud adjusts in real-time to provide trend and momentum signals.
The session volume profile updates dynamically to highlight high-liquidity zones and potential breakout areas.
Alerts can be set up in Tradingview allowing traders to know the price action in real time.
How to Use This Indicator in Trading:
Trend Confirmation: Use VWMA, VWAP, and the Ichimoku Cloud to determine the prevailing trend and avoid trading against market momentum. Go with the trend.
Reversals: Look at the dynamic Fibonacci levels to find key support and resistance areas where price may reverse or consolidate. These levels change color as they become support or resistance.
Breakout & Continuation Trading: Monitor VWAP deviations and Ichimoku signals to identify strong trend continuation setups.
Mean Reversion: Use VWAP re-tests to spot potential pullback entries in established trends.
Alerts: Customize alerts to stay ahead of market moves.
Take advantage of paper trading feature available in Tradingview to familiarize yourself with this indicator. Experience is the best teacher as in any other case.
Ideal for:
✅ Traders looking to capitalize on VWAP trend and level.
✅ Traders utilizing Fibonacci levels and Ichimoku trends for structured trades.
✅ Scalpers leveraging levels and trends for quick entries/exits.
✅ Traders who rely on volume-backed trend confirmations.
No indicator is perfect so take everything with a pinch of salt.
Drop a comment below with your feedback or if you have any question.

Value Area - Day Trading SuiteValue Area Day Trading Suite
A professional-grade indicator designed specifically for day traders who utilize Volume Profile and Auction Market Theory. This suite provides tracking of previous day's value areas, helping traders identify how current price interacts with these established institutional levels.
It tracks how much time has spent within the value area without Level to Help Measure Acceptance
Key Features
- Previous Day's Value Area tracking (VAH, POC, VAL)
- Precise time-in-value-area measurement
- Cash session integration with major market timezones
- Value Area acceptance alerts
Trading Applications
Perfect for day traders who:
- Trade using previous day's Volume Profile levels
- Focus on institutional price acceptance/rejection
- Trade market structure using confirmed value areas
- Want to automate their value area analysis
- Trade during specific market sessions
Value Area Analysis
The indicator tracks how long price stays within the previous day's value area, helping traders:
- Identify Potential Support / Resistance Levels
- Spot acceptance of established levels
- Find high-probability trading opportunities
- Time their entries and exits more effectively
Professional Tools
- Customizable cash session times for different markets
- Multiple timezone support
- Flexible dashboard positioning
- Clean, professional appearance with adjustable colors
- Alert system for value area acceptance
Built for day traders who utilize value areas

Altcoins Screener [SwissAlgo]Introduction: The Altcoins Screener at a Glance
The Altcoins Screener is a cryptocurrency analysis tool designed to provide an overview of potential trading opportunities across multiple crypto coins/tokens and categories. By combining technical analysis, price action assessment, and social metrics (via LunarCrush data), it presents market information and trading signals for a broad range of altcoins (approx. 300 USDT.P pairs of 9 crypto categories).
The screener is designed to consolidate market information onto a single chart , aiming to streamline the analysis of market conditions. It provides a consolidated market overview, which can simplify the assessment of market conditions, compared to monitoring individual charts with several layered indicators.
Key Features:
🔹 Multi-category analysis covering 300 crypto pairs of 9 categories on a single chart (Layer 1 & Top Coins, Layer2 & Scaling, Defi & Landing, Gaming & Metaverse, AI & Data, Exchanges & Trading, NFT & Social, Memes & Community, Other, User's Custom Portfolio).
🔹 Technical analysis with trade signals (Long/Short) based on an aggregated view of technical and social data points
🔹 Social sentiment integration through LunarCrush metrics (GalaxyScore, AltRank, Social Sentiment)
🔹 Real-time market scanning provides automated alerts when market conditions for specified coins/tokens potentially change.
🔹 Custom watchlist support for personalized monitoring (users can define a custom category containing a set of specific cryptocurrencies, i.e. own portfolio).
The screener presents data in a table format, using color-coded indicators to aid visual analysis. Detailed technical information is also provided. The assessments/trade signals provided by this indicator should be considered as one input among many when forming your trading strategy.
--------------------------------------
What It Does
The Altcoins Screener is a cryptocurrency analysis tool that offers:
Data Display and Analysis (Technical/Social):
🔹 Technical Metrics
* Technical Raw Data : Displays raw values for a range of technical indicators, including RSI, Stochastic RSI, DMI/ADX, RVI, ATR, OBV, and Hull Moving Averages (including their recent trends and potential significance).
Detailed view of key technical indicators, for further analysis and evaluation:
* Technical Analysis (Summary) : Provides a summarized interpretation of technical conditions based on aggregated parameters:
* Price Action
* Trend
* Momentum
* Volatility
* Volume
Summarized view of confluences for potential long/short bias:
🔹 Social Metrics (LunarCrush) : Presents data from LunarCrush®, including Galaxy Score®, AltRank®, and Social Sentiment® (including their recent trends and potential significance).
Lunarcrush data for the top 10 coins for each crypto category:
🔹 PVSRA (Price Volume & Market Makers Activity) Candles : Shows special candles highlighting potential market maker activity and volume anomalies, helping identify possible manipulation zones (including imbalance zones, i.e. price areas that market makers may revisit)
--------------------------------------
Key Features:
Automated trade signals (Long/Short) are generated based on algorithmic calculations and signal confidence levels across technical and social data points. These signals are intended to be used as one component of a broader trading strategy.
Custom sensitivity settings allow users to adjust the analysis timeframe (options: 1D, 2D, or 1W). Higher timeframes may provide a broader perspective, while the 2D setting is the default configuration.
Multi-category analysis covering a selection of approximately 300 crypto pairs across 9 predefined crypto categories.
Custom symbol selection: Users can define a custom list of up to 10 symbols for focused monitoring.
Automated Alerts to track potential trend changes across crypto categories (Long to Short to Neutral, or vice versa)
Visual Interface:
Organized table display with color-coded indicators to aid interpretation.
Clear and efficient format for scanning market information.
--------------------------------------
Target Audience
🔹 The screener is designed for cryptocurrency traders who:
Need to efficiently monitor multiple USDT perpetual futures markets
Use technical analysis in their trading decisions
Want to track sector-wide movements across crypto categories
🔹 Suitable for different trading styles:
Scalpers requiring quick market assessment
Swing traders analyzing multi-day trends
Position traders monitoring longer-term setups
The color-coded interface makes it accessible for intermediate traders while providing detailed metrics for advanced users. A basic understanding of technical analysis and crypto trading is recommended.
--------------------------------------
How It Works
The Altcoins Screener evaluates cryptocurrencies through a multi-layered analysis:
🔹 Core Analysis Components
Each parameter combines multiple indicators for comprehensive evaluation:
Price Action
EMA crossovers and momentum
Support/resistance zones
Candlestick patterns
Trend
Hull Moving Average system
DMI/ADX trend strength
Multi-timeframe confirmation
Momentum
RSI/Stochastic RSI readings
MACD convergence/divergence
Oscillator confirmations
Volatility
RVI/ATR measurements
Bollinger Bands behavior
Historical volatility trends
Volume
OBV trend analysis
Volume/price correlations
Volume profile assessment
🔹 Signal Generation Process
1. Real-time data collection across timeframes
2. Weighted indicator calculations
3. Parameter aggregation and analysis
4. Signal strength determination
5. Color-coding and alert generation
--------------------------------------
How to Use
🔹 Initial Setup:
Add the indicator to a chart (use the 1D timeframe)
Select your preferred crypto category or create a custom list
Choose between Technical Analysis or Technical Metrics view
Set data sensitivity based on your trading style
🔹 Using the Technical Analysis View:
Monitor color-coded dots for quick market assessment
Green: bullish conditions
Red: bearish conditions
Gray: neutral conditions
Check the "Trade Signal" column for potential Long/Short entries signaled by confluences among technical and/or social data points
🔹 Using the Technical Metrics View:
Review detailed numerical values
Monitor slopes (↑↓ arrows) for the most recent trend direction of each data point
Watch for pivotal points (highlighted cells): these are data points that suggest potential trend reversals
Focus on the confluence of multiple indicators
The technical metrics view corroborates the conclusions shown in the Technical Analysis View, providing more details about some critical data points.
🔹 Alert Configuration:
Enable Technical Alerts for signal notifications (which coin/token seems most suited for Long or Short trades, and which coin/token is in a neutral/uncertain state for trading = "No Trade")
Configure alert conditions based on trading style
Set timeframe-appropriate sensitivity
Monitor alert messages for trade signals
Instructions on how to set alerts are provided in the script (enable "Signals Setup Instructions" in User Interface to get a step-by-step guide about setting up alerts)
Best Practices:
Confirm signals across multiple timeframes
Use appropriate sensitivity for your trading style
Monitor multiple categories for sector rotation
Combine signals with your trading strategy
Verify signals with price action confirmation and deep dive into the charts of your potential targets
--------------------------------------
About the Settings
🔹 Crypto Category Selection
Layer 1 & Major: Top market cap coins (BTC, ETH, XRP,...), established protocols
Layer 2 & Scaling: ETH L2s, scaling solutions
DeFi & Lending: Decentralized finance protocols
Gaming & Metaverse: Gaming and virtual world tokens
AI & Data: Artificial intelligence and data projects
Exchange & Trading: Exchange tokens, trading protocols
NFT & Social: NFT platforms, social tokens
Memes & Community: Community-driven tokens
Others & Misc: Other categories
Custom Category: User-defined list (up to 10 symbols)
Data Type Options
Technical Analysis: Color-coded summary view
Technical Metrics: Detailed numerical values of some key technical data points
Sensitivity Settings
Higher: Shorter timeframe, more frequent signals
Default: Balanced timeframe, standard signals
Lower: Longer timeframe, stronger signals
Alert Settings
Technical Alerts: Trade signal notifications
Data Timeframe: Minimum 1D required
Theme: Dark/Light mode options
Note: All analysis is performed on USDT Perpetual Futures pairs from Binance
--------------------------------------
FAQ
Q: Does the screener work on other exchanges besides Binance?
A: No, it's designed specifically for Binance USDT Perpetual Futures pairs. Binance offers the highest liquidity and trading volume in the crypto derivatives market, making it ideal for technical analysis. The extensive range of trading pairs and reliable data streams help ensure more accurate signals and analysis. Using a single high-liquidity exchange also helps avoid inconsistencies that could arise from aggregating data across multiple platforms with varying liquidity levels.
Q: What's the minimum timeframe required?
A: The screener requires a minimum 1D (daily) timeframe. This requirement ensures that the technical analysis has sufficient data points for reliable signal generation. Lower timeframes can produce more noise and false signals, while daily timeframes help filter out market noise and identify stronger trends.
Q: Why are some social metrics showing "NaN"?
A: "NaN" (Not a Number) appears when cryptocurrencies don't have associated LunarCrush data. This typically occurs with newer tokens or those with lower market caps. The technical analysis remains fully functional regardless of social metric availability, as these are complementary data points.
Q: How often are signals updated?
A: Signals update with each new candle on the selected timeframe (1D, 2D, or 1W). For example, on the default 2D setting, signals are recalculated every two days as new candles form. This helps reduce noise while maintaining timely analysis of market conditions.
Q: Can I add spot trading pairs?
A: No, the screener is optimized for Binance USDT perpetual futures pairs for data consistency and analysis purposes. While spot and perpetual prices typically align closely due to arbitrage, using a single data source (Binance) and contract type (USDT perpetual) ensures uniform data quality and analysis across all pairs. This standardization helps maintain reliable technical analysis and signal generation.
Q: How many coins can I add to my custom list?
A: Users can add up to 10 custom symbols to their watchlist. This limit is designed to maintain optimal performance while allowing focused monitoring of specific assets. The custom list complements the predefined categories that cover over 300 pairs.
Q: What determines signal confidence levels?
A: Signal confidence is calculated through a weighted algorithm that considers multiple factors: trend strength (Hull MA, DMI/ADX), momentum indicators (RSI, SRSI), volatility measurements (RVI, ATR, BB), volume analysis (OBV, volume trends), and price action patterns. Higher confidence levels indicate stronger alignment across these factors.
Q: Are signals guaranteed to work?
A: No. Signals are analytical tools based on historical and current market data, not guaranteed predictions. They should be used as one component of a comprehensive trading strategy that includes proper risk management, position sizing, and additional confirmation factors. Past performance does not guarantee future results.
Q: Why does the screener need higher timeframes?
A: Higher timeframes (1D minimum) provide several benefits: reduced market noise, more reliable technical signals, better trend identification, and lower likelihood of false signals. They also align better with institutional trading patterns and allow for a more thorough analysis of market conditions across multiple indicators.
--------------------------------------
Conclusion
The Altcoins Screener is a comprehensive crypto market analysis tool that:
Scans 300+ cryptocurrencies across 9 sectors on a single chart
Combines technical indicators and social metrics for signal generation
Identifies potential trading opportunities through color-coded visuals
Saves time by eliminating the need to monitor multiple charts
The tool is suited for:
Market overview and sector rotation analysis
Quick assessment of market conditions
Technical and social sentiment tracking
Systematic trading approach with alerts
Use this screener with caution and as a complement to any other tool you use to define your trading strategy.
--------------------------------------
Disclaimer
This indicator is for informational and educational purposes only:
Not financial advice: This indicator should not be considered investment advice.
No guarantee of accuracy: The indicator's calculations and signals are based on specific algorithms and data sources, but accuracy cannot be guaranteed. Market conditions can change rapidly.
Past performance is not predictive: Past performance of the indicator's signals or any specific asset is not indicative of future results.
Substantial risk of loss: Trading cryptocurrencies involves a substantial risk of loss. You can lose money trading these assets.
User responsibility: Users are solely responsible for their own trading decisions and should exercise caution.
Independent research required: Always conduct thorough independent research (DYOR) before making any trading decisions.
Technical analysis is one of many tools: Technical analysis, including the output of this indicator, is just one tool among many and should not be relied upon exclusively.
Risk management is essential: Use proper risk management techniques, including position sizing and stop-loss orders.
Comprehensive strategy: Use this tool as part of a comprehensive trading strategy, not as a standalone solution.
No liability for trading results: The Author assumes no responsibility or liability for any trading results or losses incurred as a result of using this indicator.
No TradingView affiliation: SwissAlgo is an independent entity and is not affiliated with or endorsed by TradingView.
LunarCrush data: The indicator utilizes publicly available data from LunarCrush. LunarCrush data and trademarks are the property of LunarCrush.
Consult a financial advisor: Consult with a qualified financial advisor before making any investment decisions.
By using this indicator, you acknowledge and agree to these terms. If you do not agree with these terms, please refrain from using this indicator.

Bondar Drive v2.1Title: Bondar Drive v2.1 — Real-time print and delta tick volume visualization
Description:
Bondar Drive v2.1 is a tool for visualizing real-time order flow data. It highlights price movements and volume deltas in an intuitive, easy-to-read format. Indicator can be used in conjunction with the Anchored Volume Profile and Volume Footprint (Type: Total).
Features:
Real-Time Print Visualization:
Displays order flow prints with delta colors for buy/sell dominance.
Adjustable size and transparency for varying order thresholds.
Volume Delta Analysis:
Categorizes orders into Tiny, Small, Session, Large, and Huge based on user-defined thresholds.
Provides a tooltip showing order time and price.
Customizable Time Range:
Keeps prints visible for a specified duration (in seconds).
Flexible User Inputs:
Adjustable time zones, print sizes, starting bar index, and volume thresholds.
Visual Enhancements:
Line connections between prints show progression of orders and market direction.
How It Works:
The indicator gathers volume delta and price data in real time.
It dynamically displays circular labels with varying sizes and colors, reflecting the size and type of orders. Labels and lines are automatically removed after the specified time range, ensuring a clean and uncluttered chart.
Customization Options:
Number of Prints: Control how many prints are displayed.
Order Size Filters: Exclude small trades to highlight significant orders.
Color Options: Customize print colors, text, and connecting lines.
Time Offset: Adjust for your local time zone.
Use Cases:
Identify order flow imbalances and price levels dominated by buyers or sellers.
Track the progression of large orders for better trade execution.
Spot market reversals and momentum shifts using real-time prints and delta.

Trend_Prime_MasterTrend_Prime_Master is a trend-following indicator designed to help traders identify potential buy and sell signals with enhanced clarity and reliability. This indicator integrates multiple technical analysis tools into a cohesive system, maximizing their individual strengths to offer traders a comprehensive view of market trends. With its advanced blend of market structure analysis, multiple EMAs, custom volume and momentum indicators, and multi-timeframe trend confirmation, Trend_Prime_Master is tailored to navigate the complexities of financial markets.
Core Features
Trend_Prime_Master offers a suite of features that provide in-depth analysis and actionable insights into market trends:
Multi-Timeframe Trend Analysis: This feature ensures that the signals you act on are aligned with broader market trends by filtering and confirming them across various timeframes. By aligning your trades with the larger market direction, you improve the overall consistency of your trading decisions.
Sophisticated Signal Generation: Signals are generated based on a confluence of technical conditions, including Exponential Moving Average (EMA) crossovers and custom momentum indicators. This multi-layered approach helps focus on signals that have strong backing from market conditions, thereby increasing the reliability of trading decisions.
Color-Changing Trend Line: The trend line changes color based on the market's current direction, providing a quick visual cue for traders. Green indicates a bullish trend, while red signals a bearish trend. This feature simplifies the process of identifying trends, allowing traders to make informed decisions at a glance.
Adaptive Lines: The adaptive lines in Trend_Prime_Master adjust dynamically based on market conditions. These lines provide a more responsive view of the trend compared to static moving averages, particularly useful in volatile markets.
Short Trend Lines: In addition to the main trend line, Trend_Prime_Master includes short trend lines that focus on immediate market movements. These lines are based on shorter EMAs and offer additional layers of trend confirmation, particularly in fast-moving markets.
Custom Volume and Momentum Indicators: These advanced tools validate the strength of trends by assessing the underlying market pressure and the speed of price movements, ensuring that signals are supported by substantial market activity.
Heikin Ashi Integration: Heikin Ashi candles are used to smooth out price data, reducing noise and providing a clearer view of the underlying trend. This integration enhances the clarity and reliability of the signals, making it easier to follow the trend and make informed decisions.
CHoCH (Change of Character): CHoCH is a critical component in understanding market structure changes. It occurs when the market shows a significant shift in behavior, such as moving from a trending phase to a consolidation phase, or vice versa. Trend_Prime_Master automatically detects and labels CHoCH on the chart, helping traders anticipate potential reversals or shifts in market momentum.
Detailed Component Explanations
Every component in Trend_Prime_Master has been carefully selected and integrated to enhance the overall performance of the indicator. Here’s a detailed explanation of how these components work together:
EMA Combinations for Trend Identification: Trend_Prime_Master utilizes multiple EMAs with different periods to capture both short-term and long-term trends. By analyzing the relationship between faster and slower EMAs, the indicator identifies potential trend reversals and continuations. The combination of multiple EMAs helps in smoothing out price data, reducing noise, and providing a more accurate depiction of the trend.
Adaptive Lines: The adaptive lines in Trend_Prime_Master adjust dynamically based on changing market conditions. Unlike static moving averages, which use a fixed calculation period, adaptive lines recalibrate themselves to respond more effectively to shifts in market momentum. This allows traders to capture emerging trends more quickly and avoid the lag associated with traditional moving averages.
Short Trend Lines: Short trend lines are calculated using faster EMAs and are designed to highlight immediate market trends. These lines are particularly useful for traders who focus on short-term market movements, providing early indications of potential trend reversals or continuations. By combining short trend lines with longer EMAs, Trend_Prime_Master offers a multi-layered approach to trend analysis, ensuring that both short-term and long-term perspectives are considered.
Point of Control (POC):
The Point of Control (POC) is a key concept in volume profile analysis that represents the price level with the highest traded volume over a specific period. In Trend_Prime_Master, the POC line is automatically calculated and plotted on the chart. This level is crucial because it often acts as a significant support or resistance level, where price tends to gravitate towards or bounce off. By incorporating the POC, Trend_Prime_Master enhances your ability to identify critical price levels that are likely to influence future price movements.
The POC works synergistically with other components like EMAs and custom momentum indicators by confirming whether these technical signals align with high-volume price levels. For instance, a buy signal near the POC might suggest a strong support level, making the trade more likely to succeed, while a sell signal below the POC could indicate a potential breakout or continuation of a downtrend.
Break of Structure (BOS): BOS is a crucial concept in market structure analysis that indicates a significant change in market behavior. It occurs when the market breaks a previous high or low, suggesting a potential reversal or continuation of the trend. In Trend_Prime_Master, BOS is used to identify these critical moments, helping traders anticipate major market moves. BOS works in conjunction with other signals, such as EMA crossovers and trend line changes, to provide a comprehensive picture of the market's direction.
CHoCH (Change of Character): CHoCH refers to a sudden and significant shift in market behavior, often signaling a change from a trending market to a ranging one, or vice versa. This concept is crucial for traders who need to adjust their strategies based on the market’s current phase. Trend_Prime_Master automatically detects CHoCH moments and marks them on the chart, allowing traders to adapt their strategies promptly and effectively.
Custom Volume and Momentum Indicators: These custom indicators in Trend_Prime_Master go beyond standard tools by incorporating advanced calculations that consider both the direction and intensity of market moves. These indicators help validate the strength of a trend, ensuring that traders act on signals backed by strong market activity. This allows for a more nuanced view of trend strength, supporting better trading decisions.
Color-Changing Trend Line: This visual tool is not just a simple trend line; it dynamically adjusts its color based on the current trend direction, providing an immediate visual representation of the market’s state. When combined with other components like BOS and custom volume indicators, the color-changing trend line helps traders quickly assess whether the current market conditions favor a particular trade, reducing the cognitive load on traders and enabling faster decision-making.
Multi-Timeframe Filters: These filters ensure that the signals generated on a lower timeframe are consistent with the trends observed on higher timeframes. A signal is only considered valid if it aligns across these multiple timeframes, ensuring that your trades are supported by the broader market context.
Heikin Ashi Smoothing: Heikin Ashi candles are incorporated into Trend_Prime_Master to smooth out noise in price data. These candles average out price movements, making it easier to identify the underlying trend without being distracted by minor fluctuations. This smoothing effect is particularly useful in volatile markets, where traditional candlesticks might present a confusing picture of market behavior.
How It Works
Trend_Prime_Master integrates these tools into a cohesive system designed to provide clear and actionable insights into market trends:
EMA-Based Trend Identification: By analyzing multiple EMAs, Trend_Prime_Master identifies the prevailing market trend and potential reversals. This process involves comparing the positions of faster and slower EMAs to detect crossovers, which are key signals for trend changes.
Adaptive Lines: These lines adjust in real-time to reflect the current market conditions. They offer a more responsive trend-following approach compared to traditional moving averages, making them particularly useful in volatile or rapidly changing markets.
Short Trend Lines: These lines focus on short-term market trends, providing early signals of potential reversals or continuations. By tracking immediate price movements, short trend lines help traders respond quickly to market changes, offering a valuable perspective in fast-moving markets.
Point of Control (POC):The POC represents the price level with the highest traded volume over a specific period. In Trend_Prime_Master, the POC is plotted to help traders identify key levels where the market has shown significant interest. These levels often act as strong support or resistance and can be crucial in determining the validity of a trend. For instance, a signal near the POC might indicate a more reliable setup, as it shows that the price is aligning with a major volume level.
Break of Structure (BOS): BOS plays a pivotal role in confirming trend reversals. When the price breaks a significant structure, such as a previous high or low, it suggests that the market may be shifting direction. This is particularly important for traders looking to enter the market at the beginning of a new trend.
CHoCH (Change of Character): CHoCH is critical for recognizing shifts in market phases. For example, a CHoCH might indicate that a market is moving from a trend into a consolidation phase, or vice versa. By identifying these changes early, Trend_Prime_Master allows traders to adjust their strategies accordingly, whether that means tightening stop-losses in a trending market or preparing for breakout trades in a consolidating one.
Custom Volume and Momentum Confirmation: These custom indicators add an extra layer of validation to the signals generated by Trend_Prime_Master. By confirming that there is strong market participation and momentum behind a move, these indicators help ensure that traders are acting on signals supported by robust market activity.
Color-Changing Trend Line: This feature provides an easy-to-understand visual representation of the market's direction, changing color based on whether the market is in a bullish or bearish phase. It works in tandem with other components like EMAs and custom volume indicators to give traders a quick, comprehensive view of market conditions.
Settings
• Trading Style: Select the trading style that best suits your strategy (Short, Medium, Long, HTSpecial, Standard). This setting adjusts the parameters of the EMAs and other components to align with different timeframes, ensuring that the indicator is tuned to the specific market conditions you're trading in.
• Show Possible Signals: Toggle this setting to enable or disable the display of possible buy and sell signals. This allows traders to focus on confirmed signals or to see potential opportunities as they develop.
• Possible Signals Filter: If you wish to filter possible signals based on a higher timeframe trend, enable this option and select the appropriate higher timeframe. This helps ensure that the signals you act upon are in sync with broader market trends, reducing the risk of counter-trend trades.
Colors for Signals and Moving Averages:
• Customize the colors for bullish, bearish, and neutral signals, as well as for the various moving averages. This allows traders to personalize the visual aspects of the indicator, making it easier to interpret signals at a glance.
Trend Line Settings:
• Adaptive Line: Toggle to enable or disable the adaptive trend line, which adjusts dynamically based on market conditions. The line changes color to reflect the current trend direction, providing a quick visual cue.
• Short Trend Lines: Enable this option to display shorter-term trend lines. These lines help in identifying immediate market movements and can be particularly useful for short-term traders.
• Length and Smoothing: Adjust the length and smoothing parameters for the trend lines to fine-tune how responsive they are to price changes.
Point of Control (POC) Settings:
• Show POC Line: Toggle this setting to display the POC on your chart. The POC is a critical level where the most volume has been traded, and it often acts as a significant support or resistance level.
• POC Color and Width: Customize the color and width of the POC line to make it stand out or blend in with your other chart elements, depending on your preference.
Why It's Worth Paying For
Trend_Prime_Master provides several unique advantages that make it a valuable tool for traders:
Comprehensive Market Analysis: By integrating multiple technical analysis tools, Trend_Prime_Master provides a holistic view of market trends, helping you make more informed decisions.
Customization and Flexibility: The indicator’s settings can be easily adjusted to suit your trading style, whether you’re focusing on short-term trades or long-term investments.
Reliable Signal Generation: The multi-layered approach—combining EMAs, custom volume indicators, and trend lines—minimizes the likelihood of weak signals, enhancing your trading process.
Advanced Features: Features like multi-timeframe analysis, Heikin Ashi smoothing, and the color-changing trend line provide insights that are not typically found in other indicators, giving you a trading edge.
Enhanced Market Understanding: The ability to detect and act on changes in trend strength and momentum helps you develop a deeper understanding of market dynamics.
Consistency Across Markets: Trend_Prime_Master is designed to perform reliably across various market conditions, making it a versatile tool in any trading environment.
User-Friendly Interface: Despite its advanced capabilities, the indicator is easy to use, making it accessible to traders of all experience levels.
Ongoing Support and Updates: As a user of Trend_Prime_Master, you receive ongoing support and regular updates to keep the indicator effective and up-to-date with the latest market trends and techniques.
Risk Disclaimer
While Trend_Prime_Master is designed to deliver robust trading signals, it’s important to maintain realistic expectations:
Performance: The indicator is based on solid technical analysis principles, but it cannot predict the future or guarantee success. It should be used as part of a comprehensive trading strategy that includes effective risk management.
Signal Reliability: The signals generated are based on historical data and trends. While they are designed to be consistent with market conditions, they cannot guarantee future outcomes. Always be prepared for unexpected market changes.
Market Conditions: Trend_Prime_Master excels in trending markets but, like any tool, its effectiveness may vary in choppy or highly volatile conditions. Adjusting the settings and strategy according to the market environment is recommended.
How to Get Access
To gain access to Trend_Prime_Master, please send me a direct message on TradingView or use the provided link to request access. Ensure that access requests are made privately so the comments section can remain focused on discussions related to the script’s performance and use.

TrendScope:TrendScope Indicator Description with First-Time User Tutorial
---
Overview:
The TrendScope indicator is designed to give traders a comprehensive view of the market by combining multiple filter sets that analyze different aspects of price action. The filter sets allow you to switch between different views effortlessly and avoid indicator clutter. Whether you're scalping, swing trading, or identifying breakout opportunities, TrendScope helps you make informed decisions by assessing momentum, volatility, trade timing, and trend direction. It also includes a scalp setup you can use to execute trades and manage risk.
---
TrendScope Filter Sets with First-Time User Setup & Tutorial
---
Filter Set A: Short-Term Momentum
Goal:
This filter focuses on the immediate market sentiment without any additional indicators. It reveals where retail traders might enter the market, potentially highlighting areas where they could be stopped out. The goal is to identify these weak spots and anticipate likely price movements that could follow.
No Additional Indicators Required:
This filter set uses moving averages (SMA 20, SMA 50, SMA 100) to determine the short-term trend.
Tutorial:
- To Confirm an Uptrend: Ensure all moving averages are aligned in sequence: SMA 20 above SMA 50, and SMA 50 above SMA 100, all trending upwards.
Action: Consider going long using the scalper in Filter Set D.
- To Confirm a Downtrend: Ensure all moving averages are aligned in sequence: SMA 20 below SMA 50, and SMA 50 below SMA 100, all trending downwards.
Action: Consider going short using the scalper in Filter Set D.
- To Confirm Consolidation: If the moving averages are not aligned or are intertwined, the market is either about to or already trending sideways. The market is in a consolidation phase.
Action: Switch to Filter Set C for further analysis.
---
Filter Set B: Long-Term Momentum
Goal:
Similar to the short-term filter, but with a broader perspective. It helps in understanding the bigger picture, providing insights into longer-term trends and potential reversals for swing trade entries.
No Additional Indicators Required:
This filter set uses moving averages (SMA 20, SMA 100, SMA 200) to determine the long-term trend.
Tutorial:
- To Confirm an Uptrend: Ensure all moving averages are aligned in sequence: SMA 20 above SMA 100, and SMA 100 above SMA 200, all trending upwards.
Action: Consider going long using the scalper in Filter Set D.
- To Confirm a Downtrend: Ensure all moving averages are aligned in sequence: SMA 20 below SMA 100, and SMA 100 below SMA 200, all trending downwards.
Action: Consider going short using the scalper in Filter Set D.
- To Confirm Consolidation: If the moving averages are not aligned or are intertwined, the market is either about to or already trending sideways. The market is in a consolidation phase.
Action: Switch to Filter Set C for further analysis.
---
Filter Set C: Trading Range
This filter uses Bollinger Bands, Volume, and Volume-Weighted Relative Volume Profile (VRVP) to identify trading ranges and predict breakouts and trade timing. In short, when Bollinger Bands contract and volume is below average, the VRVP highlights low-volume areas that can serve as breakout targets, offering a timing edge.
Goal:
Anticipate breakouts in a sideways market.
Additional Indicators Required:
- VRVP: For visualizing volume at specific price levels.
- Volume Indicator: With a 100-period moving average for anticipating low market participation.
Tutorial:
1. Setup Screen: Zoom out to see the entire consolidation phase.
2. Identify Support & Resistance:
- Use VRVP to determine VAH (upper range) and VAL (lower range) support or resistance levels.
- Identify the POC (Point of Control) as the area with the highest support or resistance.
3. Wait for Setup:
- Wait for Bollinger Bands to contract and volume to dip below the average.
- Go short if the price is at VAH, go long if the price is at VAL.
4. Action: Switch to Filter Set D for precise entry, target, and risk management.
---
Filter Set D: Scalper
After determining the market condition using the previous filter sets, you can use this filter set to hunt for trades. Designed for use with Heikin Ashi candles, this filter allows you to enter when there’s high momentum and provides a trailing stop along the way.
Goal:
Execute trades in harmony with the established trend.
Setup Rules:
1. Condition 1: You know the current trend direction as per filter set guidance (A, B, & C), and the trend is up, and you are going long.
2. Condition 2: Wait for the price to close 3 consecutive flat-bottom Heikin Ashi candles above the 7 MA. Then Enter on the open of the fourth Candle.
3. Condition 3: The 3x candles have to be above the 7 MA (red line), and the 7 MA has to be above the 50 EMA (yellow line).
Trade Management:
Use the 50 EMA (Yellow Line) as a trailing stop and hold the position until a candle opens and closes below the 7 SMA (Red Line).
---
Additional Filter Sets
These filter sets are designed to accommodate various trading strategies, allowing for flexibility depending on the trader's approach.
---
Filter Set E: VWAP
When using the VWAP filter, load the On-Balance Volume (OBV) indicator to complement your analysis. This combination can help confirm volume trends and potential price movements.
Tips:
Look for instances where the VWAP aligns with OBV divergences to confirm or negate potential trade setups.
Tutorial:
- Complement with OBV: Look for volume confirmations.
- Usage: Switch the candles to a line chart. Wait for both the line to close above the VWAP and OBV above the Smoothing Line. Then, switch to Filter Set D and hunt for a long entry as per the strategy. Do the opposite for hunting short entries.
---
Filter Set F: Super Trend
This filter is most effective when paired with the Ichimoku Cloud (using custom settings) along with the MACD and ADX indicators.
Goal:
Gauge trend strength, momentum, and support and resistance levels.
Tutorial:
- Load Ichimoku, MACD, and ADX: To gauge trend strength and momentum.
- Usage Tips:
I use the cloud to look for long periods where the clouds print horizontal levels and use them for support and resistance levels. Alternatively, use the ADX. When the price breaks up through the super trend downtrend line and retraces back to the top of the Ichimoku cloud, switch to Filter Set D and hunt for a long scalp entry. For a short entry, wait for the price to break through the Up Trend Line and retrace back up to the cloud. Then, switch to Filter Set D and use the setup to hunt for a short.
---
Filter Set G: Keltner Channels
Combine this filter with Donchian Channels and the Average True Range (ATR) for enhanced volatility analysis. This filter set works similarly to Filter Set C.
Goal:
Measure volatility and predict breakouts.
Tutorial:
- Load Donchian Channels or ATR: To measure volatility and breakouts.
- Usage Tips:
Look for the price to fall through the Keltner lower line and the ATR making a higher low. Then, use the scalper for entries, with Donchian boundaries as take-profit estimates.
---
Filter Set H: Pivot Points
This filter works with the RSI to spot divergences that could signal a trend change or reversal.
Goal:
Identify divergences and trend reversals.
Tutorial:
- Load RSI: For identifying divergences.
- Usage Tips:
Use RSI in conjunction with pivot points to identify divergences. Then, switch to Filter Set D and use the scalper to hunt for swing entries in the divergence direction.
---
Filter Set I: Opening Range Breakout
This filter uses the Seasonality indicator to gauge investor sentiment and prediction sentiment.
Goal:
Assess market sentiment and predict breakout directions.
Tutorial:
- Load Seasonality Indicator: To assess market sentiment.
- Usage Tips:
Use seasonal trends to gauge potential breakout directions. Use on the daily timeframe only. Risk on investment zones are when the price is close to the ORB low level. Realize investment profit when the price is nearing the ORB high level, considering that there has to be divergence as determined using Filter Set H.
---
By following this structured approach, traders can learn to navigate different market conditions, using TrendScope to make informed decisions based on a comprehensive analysis of momentum, trend, and volatility. The goal is to go through all the filter sets and combine them with the scalp setup in Filter Set D, using the additional filters to adapt to various strategies and market conditions.

PVSRA Candles Auto OverrideWhat does this “PVSRA Candles Auto Override” Indicator
do?
This indicator automates PVSRA analysis for crypto traders. It finds the corresponding Binance Perpetual Futures chart for the current instrument, then replaces the current chart's volume profile with the perpetual futures data (if available) to ensure the PVSRA calculation uses the most relevant volume. This not only reduces human error during market scans but also automatically selects the appropriate Binance Perpetual Futures contract, saving time and improving the accuracy of PVSRA calculations.
How can a trader use this indicator?
This helps the trader to identify if there is volume data available in an equivalent Binance Perpetual Futures chart and automatically displays it, making it easier to switch coins whilst viewing the market. Why do we want to use Binance Perpetual Futures Volume? In most markets Binance volume surpasses those of other crypto exchanges so this will give us a better view on the volume spikes in the market.
What is PVSRA and how can I trade using this indicator?
PVSRA candles are a type of candlestick chart formatting. PVSRA stands for Price, Volume, Support and Resistance Analysis.
Here's a breakdown of what PVSRA candles aim to achieve:
Combine multiple factors: They take into account price movement, trading volume, and support and resistance levels to identify potential trading opportunities.
Highlight potential imbalances: By color-coding candles based on PVSRA analysis, they aim to show areas of high volume activity, potentially representing imbalances created by market makers (large institutions that influence price).
Identify areas of revisit: The theory is that these high-volume zones may be revisited by the market in the future, as there's "unrecovered liquidity" in those areas.
Usage of the Indicator:
By default the indicator will automatically use the Equivalent Binance Perpetual Chart for the Data
You can override the symbol manually if you what to view another instrument’s data.
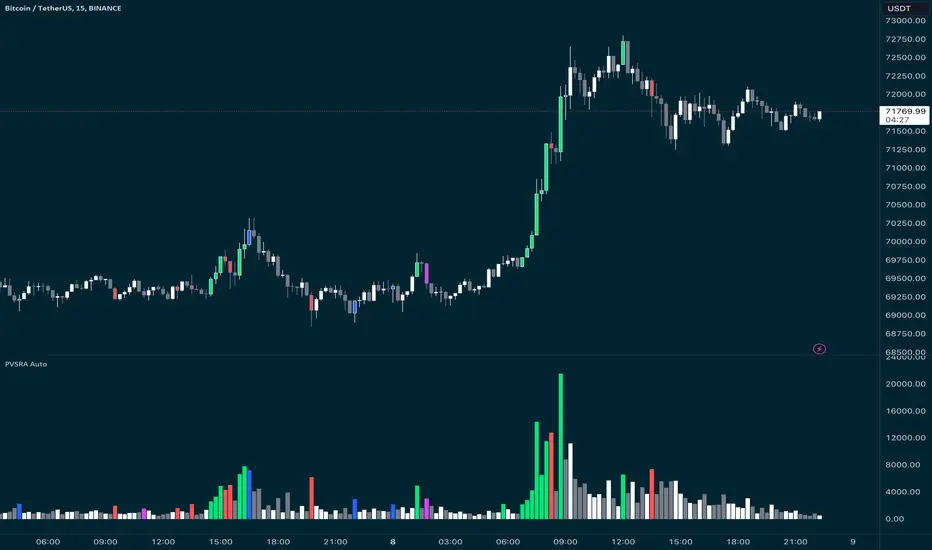
CVD Divergence Strategy.1.mmThis is the matching Strategy version of Indicator of the same name.
As a member of the K1m6a Lions discussion community we often use versions of the Cumulative Volume Delta indicator
as one of our primary tools along with RSI, RSI Divergences, Open interest, Volume Profile, TPO and Fibonacci levels.
We also discuss visual interpretations of CVD Divergences across multiple time frames much like RSI divergences.
RSI Divergences can be identified as possible Bullish reversal areas when the RSI is making higher low points while
the price is making lower low points.
RSI Divergences can be identified as possible Bearish reversal areas when the RSI is making lower high points while
the price is making higher high points.
CVD Divergences can also be identified the same way on any timeframe as possible reversal signals. As with RSI, these Divergences
often occur as a trend's momentum is giving way to lower volume and areas when profits are being taken signaling a possible reversal
of the current trending price movement.
Hidden Divergences are identified as calculations that may be signaling a continuation of the current trend.
Having not found any public domain versions of a CVD Divergence indicator I have combined some public code to create this
indicator and matching strategy. The calculations for the Cumulative Volume Delta keep a running total for the differences between
the positive changes in volume in relation to the negative changes in volume. A relative upward spike in CVD is created when
there is a large increase in buying vs a low amount of selling. A relative downward spike in CVD is created when
there is a large increase in selling vs a low amount of buying.
In the settings menu, the is a drop down to be used to view the results in alternate timeframes while the chart remains on current timeframe. The Lookback settings can be adjusted so that the divs show on a more local, spontaneous level if set at 1,1,60,1. For a deeper, wider view of the divs, they can be set higher like 7,7,60,7. Adjust them all to suit your view of the divs.
To create this indicator/strategy I used a portion of the code from "Cumulative Volume Delta" by @ contrerae which calculates
the CVD from aggregate volume of many top exchanges and plots the continuous changes on a non-overlay indicator.
For the identification and plotting of the Divergences, I used similar code from the Tradingview Technical "RSI Divergence Indicator"
This indicator should not be used as a stand-alone but as an additional tool to help identify Bullish and Bearish Divergences and
also Bullish and Bearish Hidden Divergences which, as opposed to regular divergences, may indicate a continuation.

CVD Divergence Indicator.1.mmAs a member of the K1m6a Lions discussion community we often use versions of the Cumulative Volume Delta indicator
as one of our primary tools along with RSI, RSI Divergences, Open interest, Volume Profile, TPO and Fibonacci levels.
We also discuss visual interpretations of CVD Divergences across multiple time frames much like RSI divergences.
RSI Divergences can be identified as possible Bullish reversal areas when the RSI is making higher low points while
the price is making lower low points.
RSI Divergences can be identified as possible Bearish reversal areas when the RSI is making lower high points while
the price is making higher high points.
CVD Divergences can also be identified the same way on any timeframe as possible reversal signals. As with RSI, these Divergences
often occur as a trend's momentum is giving way to lower volume and areas when profits are being taken signaling a possible reversal
of the current trending price movement.
Hidden Divergences are identified as calculations that may be signaling a continuation of the current trend.
Having not found any public domain versions of a CVD Divergence indicator I have combined some public code to create this
indicator and matching strategy. The calculations for the Cumulative Volume Delta keep a running total for the differences between
the positive changes in volume in relation to the negative changes in volume. A relative upward spike in CVD is created when
there is a large increase in buying vs a low amount of selling. A relative downward spike in CVD is created when
there is a large increase in selling vs a low amount of buying.
In the settings menu, the is a drop down to be used to view the results in alternate timeframes while the chart remains on current timeframe. The Lookback settings can be adjusted so that the divs show on a more local, spontaneous level if set at 1,1,60,1. For a deeper, wider view of the divs, they can be set higher like 7,7,60,7. Adjust them all to suit your view of the divs.
To create this indicator/strategy I used a portion of the code from "Cumulative Volume Delta" by @ contrerae which calculates
the CVD from aggregate volume of many top exchanges and plots the continuous changes on a non-overlay indicator.
For the identification and plotting of the Divergences, I used similar code from the Tradingview Technical "RSI Divergence Indicator"
This indicator should not be used as a stand-alone but as an additional tool to help identify Bullish and Bearish Divergences and
also Bullish and Bearish Hidden Divergences which, as opposed to regular divergences, may indicate a continuation.

POC IndicatorThis simplified Point of Control (POC) indicator for TradingView is designed to identify and plot the price level where the highest volume of trading occurred over a specified period. The script works as follows:
Input and Initialization: The user specifies a length for the analysis period. Variables highestVolPrice and highestVol are initialized to track the price with the highest volume and the highest volume encountered, respectively.
Volume Analysis Loop: For each bar in the specified period (up to length bars back from the current bar), the script compares the volume of the current bar (volume ) to highestVol. If the current bar's volume is higher, highestVol and highestVolPrice are updated to reflect the volume and closing price of the current bar.
Plotting the POC: Instead of using a horizontal line (hline), which cannot be dynamically updated within the loop, the script uses plot to draw the POC. This plotting function draws a line on the chart that represents the closing price level associated with the highest volume observed within the analysis period.
Resetting Variables: To ensure the indicator updates correctly with each new bar, the script resets highestVol and highestVolPrice at the start of the analysis for each new period. This step is designed to recalculate the POC dynamically as new data comes in.
This approach offers a basic method for visualizing significant price levels where substantial trading activity occurred, potentially indicating areas of strong support or resistance. However, it's a simplified model and does not calculate the true POC based on a detailed volume profile across all price levels within the period.
Volume Grid [SS Premium]Hey everyone!
This is the Volume Grid indicator. It is essentially very similar to the Volume Profile Histogram indicator I released, but this premium version overlays on the chart and provides you with the tradeable ranges and the volume composition in each range. So let's get into it!
What it does:
This indicator cumulates buy and sell volume over a user defined lookback period in addition to calculating the average ranges that the stock trades in and the volume composition in each respective range.
It then paints these ranges based on the volume composition. Red means selling and green means buying. However, the brighter the red or green, the higher the buying or selling (essentially a heatmap).
The indicator will also provide you alerts when there are buying or selling volume spikes and circle the candle in which that has happened on (see example in main chart).
These alerts can of course be toggled on or off.
Trading with it:
This indicator can be used as a stand alone trading indicator, and here is how:
The ranges act as support and resistance. Within each range you can see whether the composition is buying or selling.
If we are in a green zone, it means there is buying and it is essentially a buy the dip situation (see below example):
When we are in a heavy selling zone, its essentially a short the rip situation:
You can also see when a zone transfers from a bearish or bullish zone, to the inverse:
The indicator also will plot a POC (point of control). Because we are not only pulling from daily volume data, we will already have a well established POC going into open:
This was SPY on Friday. The POC marked the current point of control from a volume perspective, which was at 482.
And here is what happened:
The POC will change colours between Red and Green, if its a bearish POC it will turn Red, bullish green. For the most part, both the bearish and bullish POCs remain within the same range but sometimes they will diverge and the indicator will alert you when this happens.
Additional options:
In addition to toggling off and on the alerts, you can also change the text colour and size.
As well, there is an option to "Condense Range". What that will do is reduce the range by a factor of 2 (in half). This will give you more aggressive support and resistance levels that you can play.
Condensed Range:
Uncondensed Range:
Personally, I prefer the condensed range, especially when trading leveraged shares, because I treat them as support and resistance levels and play breaks of them in either direction.
And last but not least, you can adjust the ranges to the daily, hourly, monthly or any timeframe you want, you simply select your desired timeframe and it will plot the ranges for that specific period:
SOXL on the week:
The yellow line represents the current period open. It is your reference line and frequently will act as support and resistance, depending on the market sentiment at the time.
That is the indicator in a nut shell, as always, please let me know your questions and suggestions below!
Safe trades and enjoy!
For access, please review the instructions below.
